

 by
by 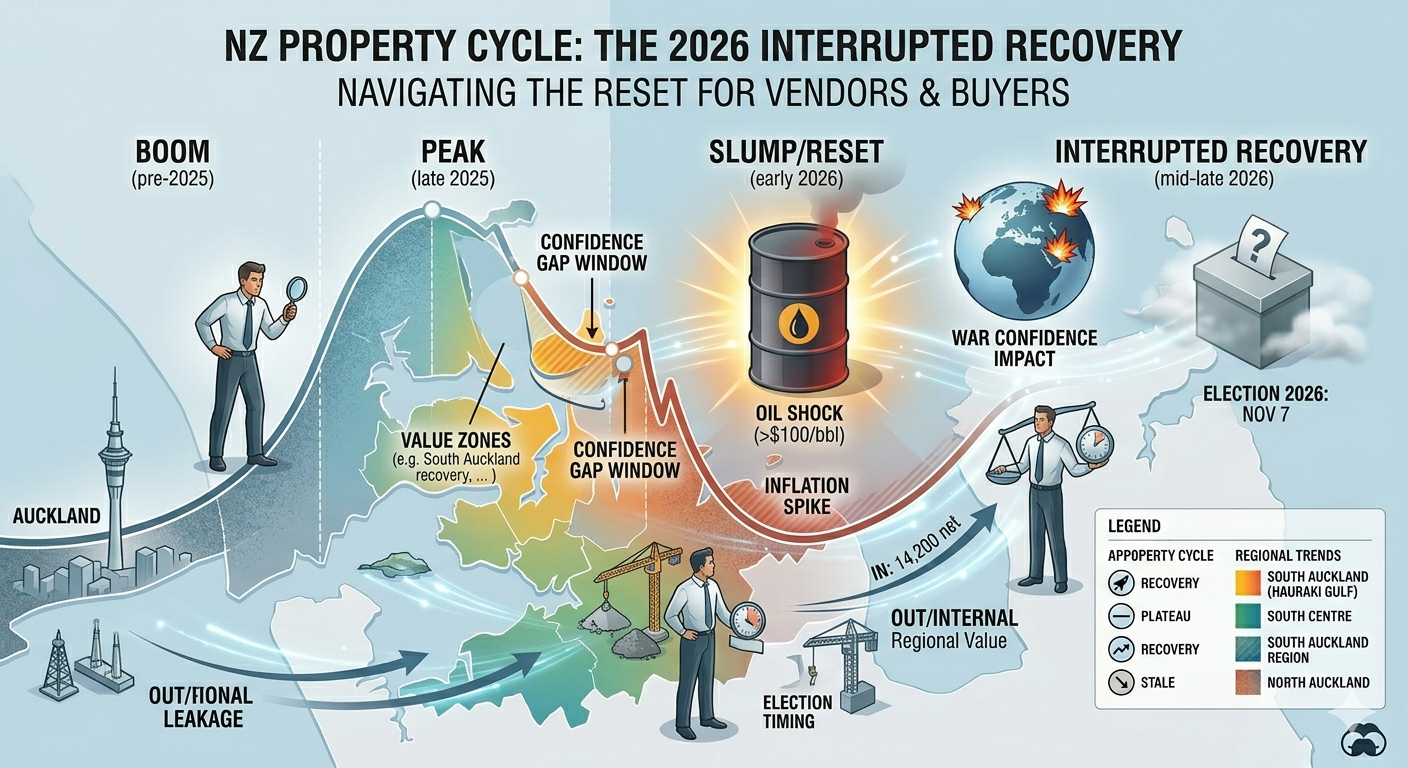
In the dynamic and often volatile landscape of 2026, the New Zealand property market is navigating a complex “reset” phase. For both vendors and buyers, understanding the property cycle is no longer just about tracking historical median prices; it is about decoding a web of global oil shocks, shifting migration patterns, rising building costs, and the looming uncertainty of an election year.
This article provides a detailed analysis of the property cycle tailored for the New Zealand environment, analyzing current drivers, breaking down the specific Auckland regional market, and offering tailored strategies for vendors and buyers.
Part 1: Anatomy of the NZ Property Cycle & The 2026 Macro Drivers
The property cycle typically moves through four distinct phases: Slump/Tread-water, Recovery, Boom, and Peak.
As of mid-2026, New Zealand is largely sitting in a fragmented recovery that has been recently interrupted by significant global and domestic volatility. While 2025 saw values stagnate or dip, early 2026 began with optimism that has since been tempered by rising costs and geopolitical tension. The market is not crashing, but it is “lumpy,” with different regions and property types performing very differently.
The 2026 Headwinds and Tailwinds
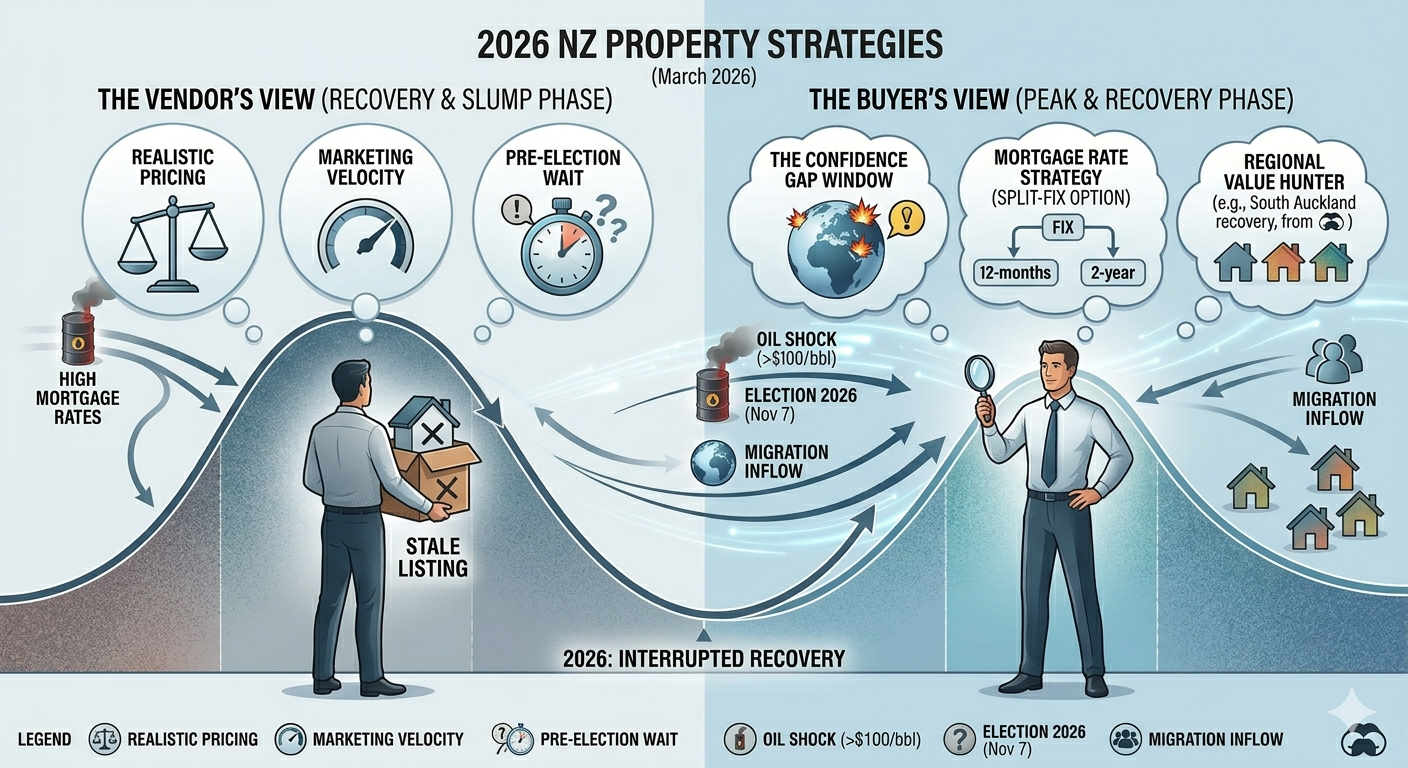
To understand the current cycle, we must analyze the specific factors shaping it in 2026. The integrated diagram below provides a visual overview of how these external forces are interacting with the Auckland market.
[Image 0: A stylized, mosaic map diagram of Auckland regions (City, South, North Shore, East, West Fringe) color-coded by cycle position. Overlaid are visual icons demonstrating the 2026 drivers: Global Volatility/War ($100/barrel oil pushing costs), stabilized high Building Costs, complex Migration (14,200 net inflow, but internal leakage), and the Election Fog (polling box with ‘NOV 7’ and question marks).]
- The Oil Shock & Geopolitical Tension (The War Factor): The ongoing conflict in the Middle East has entered a severe phase, causing global oil prices to surge toward $100/barrel in late March 2026. This is a critical driver. For NZ, this immediately spikes domestic transport and energy costs, fueling headline inflation. The Reserve Bank (RBNZ) is forced to maintain higher interest rates for longer to combat this, squeezing household budgets and reducing the maximum loan a buyer can service.
- The Building Cost Conundrum: Construction costs have stabilized at a high plateau, rising roughly 2.5% annually. While not hyper-inflating as in previous years, this high baseline cost makes new builds a premium option. For existing homes, it increases the perceived value of “turn-key” properties and makes massive renovations cost-prohibitive for many buyers.
- Complex Migration Patterns (The In and Out): Net migration in 2025 settled at approximately 14,200. While lower than the speculative, post-COVID peaks, this is still a positive driver. New arrivals (the “In”) provide a floor for rental demand, which eventually feeds into eventual home ownership. However, there is a complex “Out” factor in 2026: a notable “internal leakage” as Aucklanders move to regional “value hubs” (like Christchurch or the Waikato) seeking a lower cost of living and less exposure to high transport costs caused by oil prices.
- The Election Year Fog: With the General Election set for November 7, 2026, the market has entered its inevitable “wait-and-see” period. Historically, election years see a 15–20% drop in sales volume in the final quarter as buyers and vendors pause to see if major policies will change. In 2026, the key focal points are the potential reinstatement of interest deductibility for investors or changes to the bright-line test. This causes artificial stagnation.
Part 2: Deep Dive into Auckland Regions
Auckland is not a single property market; it is a collection of distinct regional economies that react differently to the 2026 drivers. Refer back to Image 0 for visual location context.
Auckland City Centre & Fringe (e.g., CBD, Ponsonby, Grey Lynn)
Current Phase: Plateau/Soft Patch This region is highly sensitive to confidence and international capital. While rental demand is solid (fuelled by student returns and new migration), the sales market is challenging. Oversupply of generic apartments from the previous cycle meets reduced demand as work-from-home shifts persist. Values are stable but growth is hard to find.
South Auckland (e.g., Manukau, Papatoetoe)
Current Phase: Recovery Value Zone This area has been the engine room of first-home buyer activity. Resilient due to inherent affordability and extensive transport infrastructure, South Auckland is seeing strong volume. However, because it is home to many first-home buyers and lower-to-middle income families, it is hyper-sensitive to changes in mortgage rates (driven by the oil shock). It is a recovery market built on tight margins.
North Shore & East Auckland (e.g., Takapuna, Remuera, Howick)
Current Phase: Premium Stagnation/Plateau These established, desirable family locations are seeing low turnover. Vendors here often have significant “equity luxury” and can afford to wait. They refuse to sell at a discount, but buyers are scarce at high price points given the current cost of money. The market is in a stalemate. International migration is starting to provide some support in the high-end market.
West Auckland Fringe
Current Phase: Lifestyle Volatility Zone Places like Waitakere are complex. High transport costs (driven by oil prices) make commuting from the fringe less attractive, impacting values. However, some areas benefit as internal migrants seek more space. The performance here is highly localized.
Part 3: Strategy by Perspective (Vendor vs. Buyer)
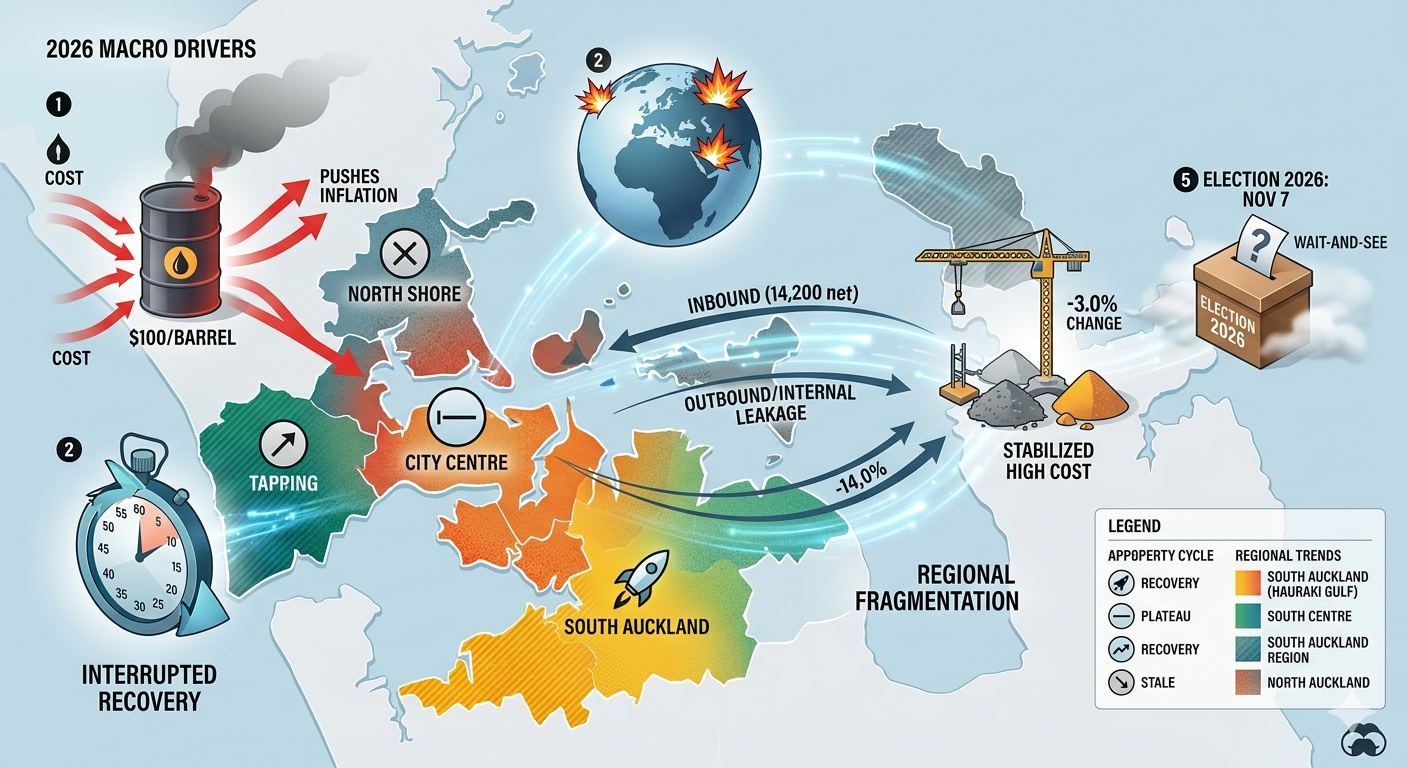
Navigating a “lumpy recovery” requires precise, data-led strategies. The infographic below simplifies the contrasting perspectives in the current cycle.
[Image 1: A two-panel infographic. The left side (Vendor’s View) faces a steep post-boom decline, holding ‘STALE LISTING’ (X-mark house) and ‘PRICING REALITY’ scales. Bubbles show ‘PRE-ELECTION WAIT’ (clock/question marks). The right side (Buyer’s View) stands confidently on the recovery slope, inspecting options with a magnifying glass. Bubbles show ‘CONFIDENCE GAP WINDOW’ (opportunity/war icons), ‘MORTGAGE RATE STRATEGY’ (split-fix compare), and ‘REGIONAL VALUE HUNTER’ (South Auckland scan). Subtly integrates the oil, migration, and election drivers from image 0.]
The Vendor’s Strategy: Precision and Velocity
In 2026, a “flat to soft” market means vendors cannot rely on market momentum to sell their properties.
- Pricing is Everything: “Testing the market” with a high price is fatal in 2026. Buyers are extremely cost-conscious and can wait. Accurately, data-led pricing is essential to capture the active buyers before the election-year paralysis takes hold. Properties priced just 3% over true market value can sit for months.
- The Turn-Key Advantage: If your home is immaculate and needs no work, emphasize this. In a high-building-cost environment, buyers value certainty over the potential risk of a renovation.
- Selling Before the Election: Aim to settle your sale before August 2026. The months immediately preceding November 7 will see a dramatic drop in active bidders as the “wait-and-see” mentality dominates.
The Buyer’s Strategy: Exploit the Confidence Gap
For those with stable employment and a deposit, the 2026 environment offers a rare window of leverage.
- Buy the “Confidence Gap”: The Middle East conflict, high oil prices, and the pre-election pause have created a “fear” discount. Speculative investors have left the field. The window of opportunity is now—before the election results provide market certainty or before the RBNZ indicates an eventual rate cut.
- Mortgage Rate Strategy is Crucial: With global drivers keeping rates high, the old strategy of “waiting for the bottom” is dangerous. Many advisors suggest a split-fix strategy (e.g., fixing part of the loan for 12 months to benefit if rates fall, and part for 2 years to hedge against extended volatility) to manage risk. Refer to Image 1’s split-fix flowchart icon.
- Target the Recovery Zones: Areas like South Auckland or West Auckland (near infrastructure improvements) offer the best balance of affordability and potential capital growth once the current macro headwinds clear. In these zones, you have strong negotiating power over vendors who are eager to close a sale.
Summary and 2026 Outlook
The NZ property cycle is currently in a complex, fragmented recovery. Global headwinds (oil, war) have raised the “cost of money,” dampening the enthusiasm that usually follows a market bottom. While prices may correct slightly or plateau in late 2026 due to the election, the fundamental lack of housing supply and continuous (albeit lower) migration inflows suggest that this is a temporary consolidation rather than a market collapse.
Disclaimer:
The information provided in this article is general in nature and should not be considered as legal, financial, or professional advice. Buyers/sellers are strongly encouraged to seek independent legal and/or financial advice from qualified professionals before making any decisions related to property transactions.


Join The Discussion